Methodological Trends in Psychology (2008-2024)
Haley Lam
2026-05-02
Overview
This piece zooms into the methodological trends of subfields in psychology using data from Lam (2025). I categorized articles from journals into subfields, then looked closer at social and personality psychology subfields.
1. Environment Setup & Data Loading
First, we load the necessary libraries and pull the dataset directly from OSF.
2. Categorization of Journals
Then, specific journals were placed into broader subfields (Clinical/Counseling, Social/Personality, Health, Developmental, etc.).
psych_data <- psych_data %>%
        mutate(Subfield = case_when(
                Journal %in% c("Journal of Anxiety Disorders",
                               "Journal of Consulting and Clinical Psychology",
                               "Journal of Clinical Child and Adolescent Psychology",
                               "Journal of Counseling Psychology",
                               "Behaviour Research and Therapy",
                               "Behavior Therapy",
                               "Journal of Traumatic Stress") ~ "Clinical/Counseling",

                Journal %in% c("Personality and Social Psychology Review",
                               "Journal of Personality and Social Psychology",
                               "Journal of Personality",
                               "Personality and Social Psychology Bulletin",
                               "British Journal of Social Psychology",
                               "Journal of Experimental Social Psychology") ~ "Social/Personality",

                Journal %in% c("Journal of Occupational Health Psychology",
                               "Health Psychology") ~ "Health",

                Journal %in% c("Developmental Science") ~ "Developmental",

                Journal %in% c("Emotion",
                   "Psychology of Women Quarterly",
                   "Journal of Positive Psychology",
                   "British Journal of Psychology") ~ "Uncategorized",

    TRUE ~ "Other"
  ))

# Display the distribution of articles per subfield
print(table(psych_data$Subfield))
##
## Clinical/Counseling Developmental Health Social/Personality
## 738 108 206 611
## Uncategorized
## 401There are 2064 total articles.
3. Trends by Subfield
Then, we aggregate the proportion of methodological approaches within each subfield by year.
# Reshape and summarize data
subfield_yearly_summary <- psych_data %>%
        pivot_longer(cols = all_of(methodologies), names_to = "category", values_to = "value") %>%
        filter(value == 1) %>%
        group_by(Subfield, year, category) %>%
        summarize(total_rows = n(), .groups = "drop") %>%
        group_by(Subfield, year) %>%
        mutate(proportion = total_rows / sum(total_rows)) %>%
        mutate(category = gsub("_", " ", category))

# Visualization
plot_subfields <- ggplot(subfield_yearly_summary,
                         aes(x = year, y = proportion, color = category, group = category)) +
        geom_line(linewidth = 1) +
        geom_point(size = 2) +
        facet_wrap(~Subfield) +
        labs(title = "Methodological Trends by Psychology Subfield (2008-2024)",
             subtitle = "Comparing the prevalence of Experimental vs. Descriptive approaches",
             x = "Year", y = "Proportion of Articles", color = "Methodology") +
        theme_bw() +
        scale_color_viridis_d(option = "D") +
        theme(legend.position = "bottom") +
        ylim(0, 1)

plot_subfields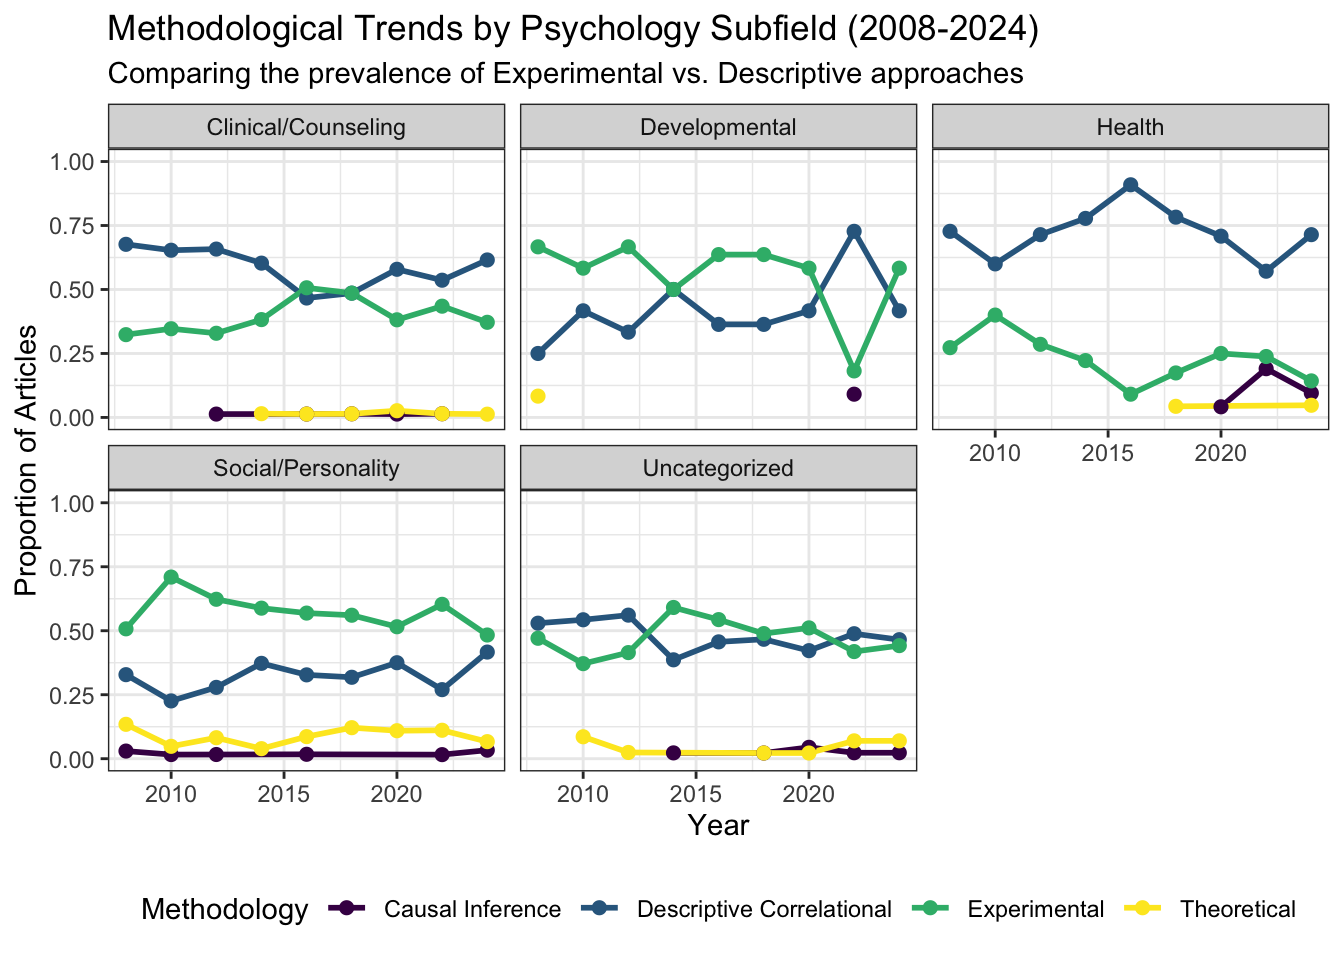
There doesn’t seem to be any linear trends, though perhaps there’s been a slight decrease in experimental papers in health psychology.
4. Deep Dive: Social/Personality Journals
Zooming in on the Social/Personality subfield, we can see if specific journals use different methodologies, and whether specific journals have trends over time.
# Filter for specific subfield
soc_pers_data <- psych_data %>%
        filter(Subfield == "Social/Personality")

# Reshape data into long
soc_pers_summary <- soc_pers_data %>%
        pivot_longer(cols = all_of(methodologies), names_to = "category", values_to = "value") %>%
        filter(value == 1) %>%
        group_by(Journal, year, category) %>%
        summarize(total_rows = n(), .groups = "drop") %>%
        group_by(Journal, year) %>%
        mutate(proportion = total_rows / sum(total_rows)) %>%
        mutate(category = gsub("_", " ", category))

# Visualization
plot_soc_pers <- ggplot(soc_pers_summary,
                        aes(x = year, y = proportion, color = category, group = category)) +
        geom_line(linewidth = 1) +
        geom_point(size = 2) +
        facet_wrap(~Journal, scales = "free_y") +
        labs(title = "Methodological Trends in Social/Personality Journals",
             x = "Year", y = "Proportion of Articles", color = "Methodology") +
        theme_bw() +
        scale_color_viridis_d(option = "D") +
        theme(legend.position = "bottom", strip.text = element_text(size = 8)) +
        ylim(0, 1)

plot_soc_pers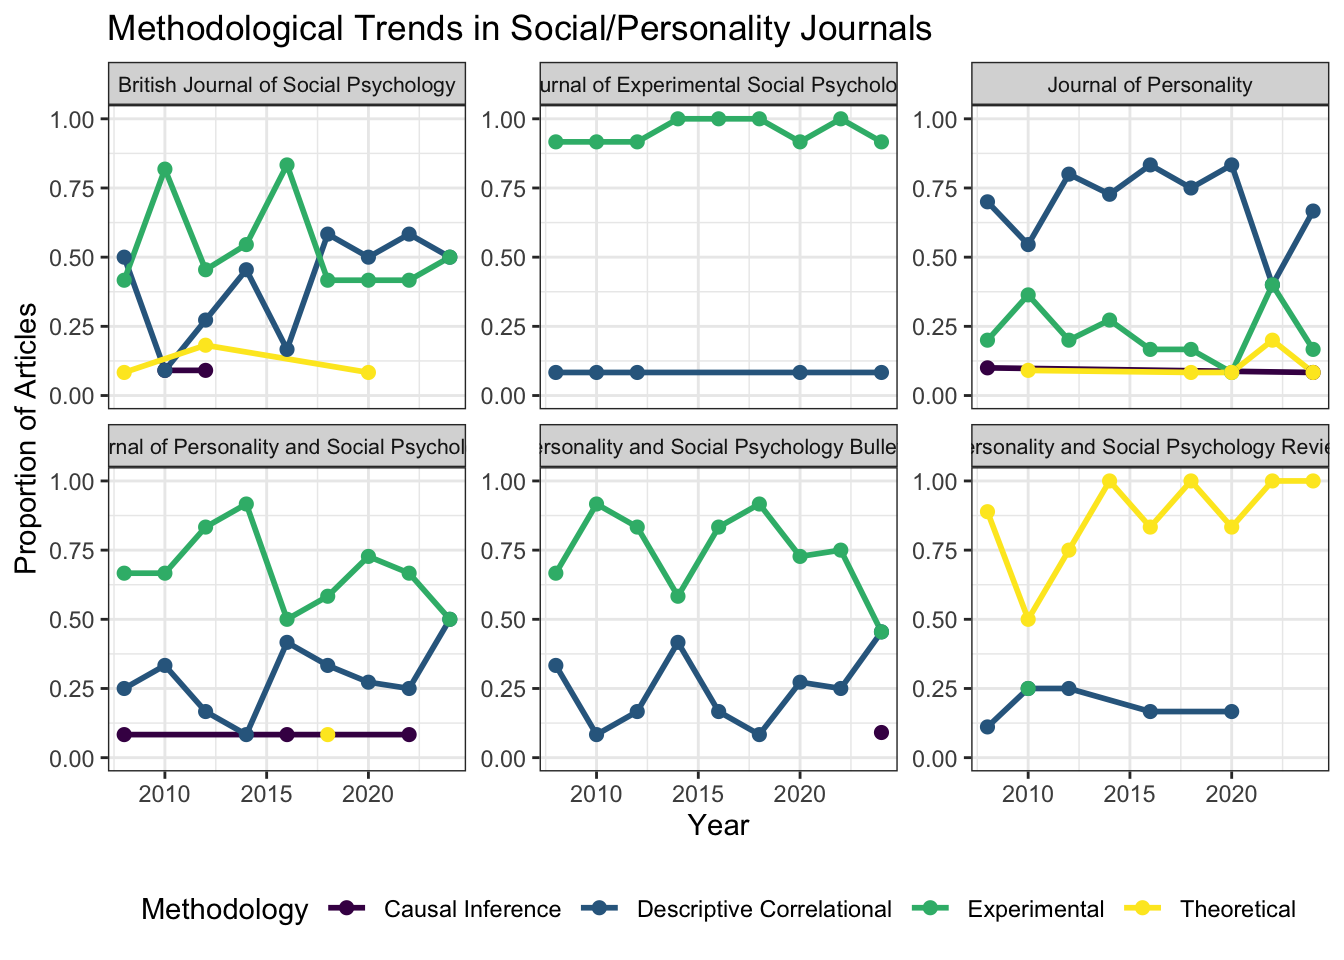
The journal of experimental social psychology, to no surprise, is almost entirely made up of experiments. JPSP seems to have an increase in correlational studies, though that trend is not stable or clear. No other journals seem to have clear trends.
Reflecting on the Lam (2025) paper, I would probably focus on only empirical journals. The one review journal (PSPR) just seems out of place, and theoretical articles are clearly largely dependent on the journal (i.e., only theory journals publish theory papers, while empirical journals rarely publish theory papers).